Einstein Analytics - Binding Toggle Steps
Create a new blank dashboard
Create Step for the chart:
- Add Dataset: DTC Opportunity
- Add Industry as Group - Vertical Axis
- Click Done to finish the step
Drag and drop the step Industry_1 into dashboard
Cmd-e or Ctrl-e to view the JSON behind the dashboard
- In this step Industry_1, locate the query.groups
- Change groups array to have "Account_Type"
Change the widgets.chart_1.columnMap object from:
"columnMap": {
                 "trellis": [],
                 "plots": [
                     "count"
                 ],
                 "dimensionAxis": [
                     "Industry"
                 ]
             }
to
"columns": [],- Click Done to view the chart grouped by Account_Type
Create Step Static Step with Custom values
- Click on Create a Static Step with Custom values
- Display Label: StaticDTC
- Create 2 Display and Value pairs:
- Display: Industry , Value: Industry
- Display: Type , Value: Account_Type
- Drag a Toggle into the dashboard
- Drag and drop the Static.StaticDTC into Toggle in the dashboard
- Select STEP when you are in the Toggle
- Change the Selection Type to : Single Selection (required)
- Cmd-E or Ctrl-E to view the JSON behind the dashboard
Write the binding
- change the state.steps.Industry_1.query.groups from:
"groups": [
                   "Account_Type"
          ]
// TO:
"groups": [
            "{{column(StaticDTC_1.selection,[\"value\"]).asObject()}}"
          ]
Save the dashboard and provide a name and app name
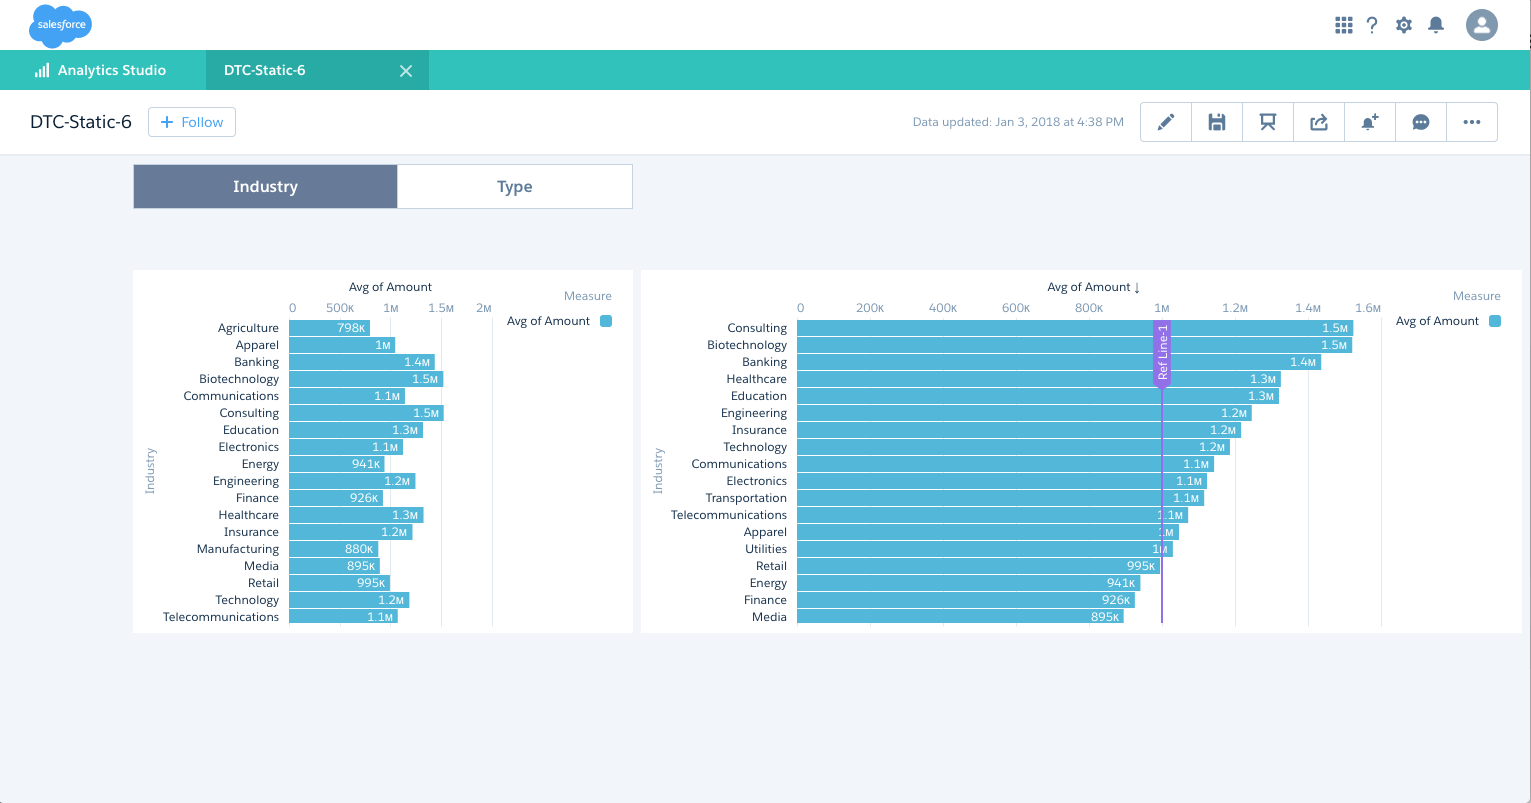
View the Dashboard and test it for the toggling feature.
- We like to show:
- ave(Amount) when Industry is selected
- count(*) when Type is selected
Add a measure column and values in the JSON for the static step
- change the state.steps.StaticDTC_1 as to add measure column:
"values": [
          {
              "display": "Industry",
              "value": "Industry",
              "measure":["avg", "Amount"]
          },
          {
              "display": "Type",
              "value": "Account_Type",
              "measure":["count", "*"]

          }
    ]
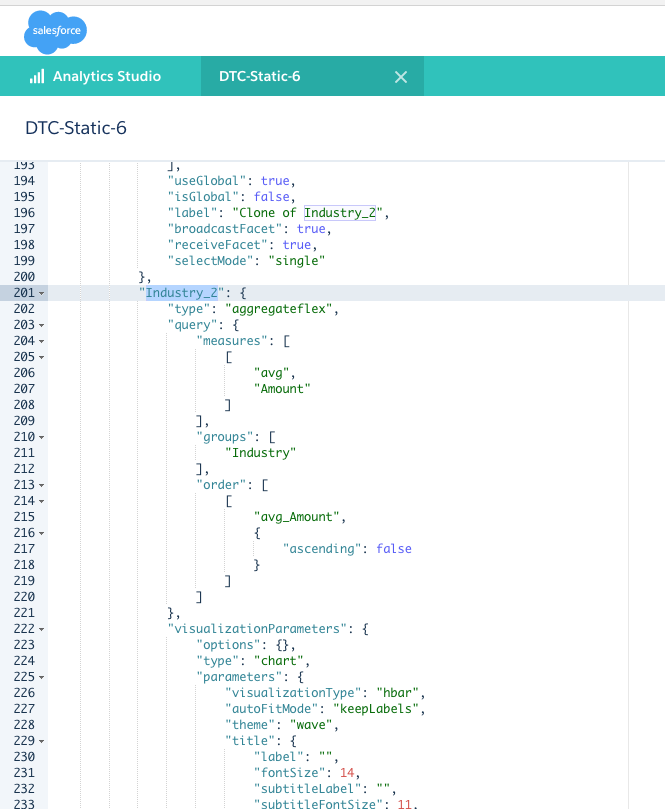
change change the state.steps.Industry_1.query to add a measure for sum(Amount):
"query": {
 "measures": "{{column(StaticDTC_1.selection,[\"measure\"]).asObject()}}",
 ],
 "groups": [
     "{{column(StaticDTC_1.selection,[\"value\"]).asObject()}}"
 ]
     }
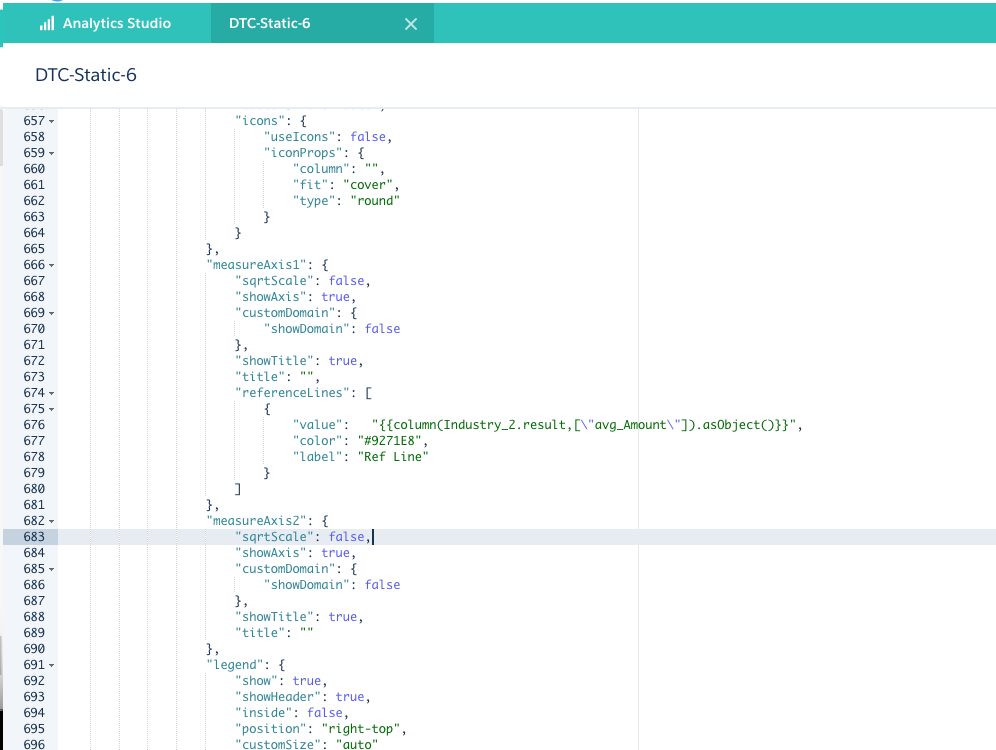
- For Reference Lines you bring the dynamic value by binding like this: Clone_of_Industry_2_1 step provides the required avg(Amount) value:
"{{column(Clone_of_Industry_2_1.result,[\"avg_Amount\"]).asObject()}}",