Einstein Analytics
Analytics collects and organizes your data in
datasets, lenses, dashboards, and apps. These collections, also known as
Analytics assets represent levels of data refinement—from raw data that’s uploaded from your source systems to highly curated, packaged views of your data.
Analytics Assets
- Dataset contains a set of source data, specially formatted and optimized for interactive exploration.
- Lens is a particular view into a dataset’s data. It’s where you do exploratory analysis and visualization.
- Dashboard is a curated set of charts, metrics, and tables based on the data in one or more lenses.
- App is a purpose-built set of analytics and answers about a specific area of your business. With apps, you can provide pathways through your data, plus powerful tools for spontaneous, deep explorations. After creating dashboards, lenses, and datasets, organize apps to present dashboards in relevant order, and then share apps with appropriate groups.
Welcome to EA!
Exploring and Visualizing Your Data Interactively
- View—View the data set
- Explore—Get to know the boundaries and shape of your data. Play with different views, zoom in and zoom out, and see what you get with different charting options.
- Refine—Narrow your view to the most important data. Decide the level of detail and categorization that’s easiest for your colleagues to understand. Choose the most appropriate chart visualization.
- Save—Save your work.
- Share—Share your view with others. For a more packaged presentation, use your visualization to build a dashboard.
Data Exploration
- Visualization is commonly a chart or graph, such as a bar chart, donut chart, timeline, or heat map. It can also be data in tabular form, such as a comparison table or pivot table. Every visualization has an underlying query, which is how Analytics retrieves information from the source data.
- Measure is a quantitative value, like revenue and exchange rate. You can do math on measures such as calculating the total revenue and minimum exchange rate. Measures have names (revenue) and values ($1,000,000). When you’re viewing a chart visualization in Analytics, it’s important to remember:
-
A measure is typically aggregated in some way, which means that it’s displayed with some math already applied to it.
For example, when you first view a dataset, you often see a simple aggregation such as the count of the number of rows. You typically aggregate by a different method—sum, average, maximum, and so on—as you explore and change or add measures, but you always specify how you want to aggregate at the time when you select the measure.
-
Dimension is a qualitative value, like region, product name, and model number. Dimensions are handy for grouping and filtering your data. Unlike measures, you can’t perform math on dimensions. Like measures, dimensions also have names (region) and values (northeast). Time is usually considered a dimension rather than a measure.
Dataflow or Recipe
Recipe Editor
Personalize, collaborate, and take action from the analytics tab
Build Analytics App
Get Answers
Trend Report Data
Explorer
Build Interactive EA Dashboards
Analytics Guide
EA Training Basic
- EA Overview (30 min.)
- Analytics Expectations & EA
- EA Assets
- EA Apps
- Data Layer Simple (90 min.)
- Dataset Builder
- Dataset from CSV
- Data Prep/Recipes
- Designer Layer - 1 (60 min.)
- Analytics Studio
- Explorer/Lens
- Dashboard Basics
- Global Filters
- Customize Tooltips
- Notifications/Annotate/Share/Download
- Values Table
- Designer Layer - 2 (4 hours)
- Compare Table
- Micro Charts/KPIs
- Linked Dashboards
- Enable Actions
- Layouts and Devices
- Salesforce Analytics Tabs
- Embed Analytics Everywhere
- Other key topics (30 min.)
- Connect Data Sources
- Pages
- Trend in Analytics
- Custom Maps
- Build a Dashboard (60 min.)
- Business Jargon to Design
- Analytics Apps (30 min.)
- Sales App
- EA Learning Adventure App
- Helpful Ext Tools (15 min.)
- Data Considerations (60 min)
- Data Layer vs Designer Layer
- Dataset Grain Level
- Technical Jargon Simplified
- Einstein Discovery (2 hours)
EA Training Intermediate to Advanced
- Platform Overview (30 min.)
- Architecture
- Security
- Analytics Setup & Permissions
- Analytics Cloud Integration User Profile
- Other key topics (30 min.)
- Bulk Actions
- SOQL/Apex Steps
- ALM - Packages & Change Sets
- Multi-Value
- Designer Layer - Technical (120 min.)
- Replication
- Connectors
- Data Landscape
- Dataflow Editor & Transformations
- Multi Dataflows
- Dataset Fields & XMD
- Dashboard JSON
- Dashboard SAQL
- Common Use Cases - (4 hours)
- Dynamic Reference Line/Label/Value
- Dynamic Group by/Sort/Measure
- Dynamic Colors (Customer Threshold)
- SAQL Custom Querying: union
- SAQL Custom Querying: cogroup
- SAQL Custom Querying: now()
EA Data Sync
- Syncs Salesforce data incrementally by default, meaning that only data that’s changed gets synced.
-
HOW TO: From Setup, enter Analytics in the Quick Find box, then select Settings. Select Enable Data Sync and Connections, and then click Save.
After you enable data sync and connections, make sure that you run data sync before your dataflows next run. Dataflows with sfdcDigest nodes fail until data sync has run and completed for the first tim
-
Up to 100 objects can be synced. For extracting more than 100 objects in your dataflows, contact Salesforce Customer Support before you enable data sync.
Data Sync only performs one sync per object. Keep this in mind if you need to perform multiple syncs from the same object. For example, if you need to sync both filtered and unfiltered data from an object.
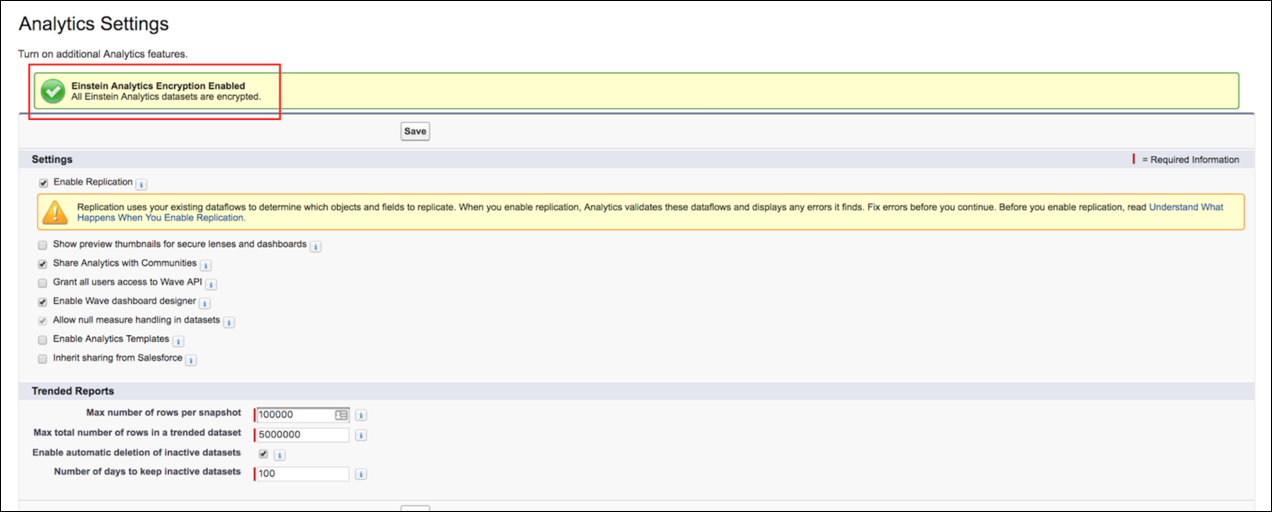
EA Data Encryption
- Extends encryption capabilities to the data at rest that is stored on the Salesforce file system.
- Einstein Analytics Encryption services are built natively into the Einstein Analytics platform. The solution applies strong, probabilistic encryption on data stored at rest. Platform encryption is based on the Advanced Encryption Standard (AES) with 256-bit keys using CTR mode for every write.
- Your org must have a Shield Platform Encryption tenant secret. (Einstein Analytics Encryption uses PE key management, so it’s not necessary to encrypt objects and fields in core Salesforce.)
-
Make sure that
- You have this feature (EA Encryption) enabled by Salesforce
- You have Manage Encryption Keys permission enabled for your profile
Demo showing how to enable this permission :

- When using Einstein Analytics with your encryption-enabled instance, data read from and written to disk is automatically encrypted with the unique key for your account.
The Einstein Analytics Encryption solution is designed to have at most a minimal performance impact on your Einstein Analytics application experience.
The keys are different for Shield Platform Encryption and Einstein Analytics Encryption. Although Shield and Einstein Analytics use the same key management technology, they use different keys.
Einstein Analytics can bring in data encrypted with Shield Platform Encryption.
Einstein Analytics reads platform encrypted data in the same way that any user reads platform encrypted data. The data is then written and encrypted in Einstein Analytics. It is not required that data be encrypted with Shield Platform Encryption to be encrypted in Einstein Analytics. It is only required that a Tenant Secret exist for the org.
EA Glossary
-
App: An app contains dashboards, lenses, and datasets in any combination that makes sense for sharing your data analyses with colleagues. apps are like folders. they allow users to organize their data projects—private and shared—and to control sharing.
- Dashboard: A dashboard is a curated set of charts, metrics, and tables based on the data in one or more lenses. Dashboard JSON file
- Dashboard JSON:
A dashboard JSON file defines the components that a dashboard contains and describes how they’re connected.
- Data Monitor:
The data monitor tool allows you to monitor dataflow and system jobs. You can also use it to start, stop, reschedule, download, and upload dataflows.
- Dataflow :
A dataflow is a set of instructions that specifies what data to extract from Salesforce objects or datasets, how to transform the datasets, and which datasets to make available for querying.
- Dataflow definition file:
A dataflow definition file is a JSON file that contains transformations that represent the dataflow logic.
- Dataflow Job:
A dataflow job processes the logic in a dataflow.
- Dataset:
A dataset contains a set of source data, specially formatted and optimized for interactive exploration.
- Dataset Builder:
The dataset builder is a point-and-click user interface that allows you to easily select and extract data from related Salesforce objects to create a single dataset.
- Date:
A date can be represented as a day, month, year, and, optionally, time. You can group, filter, and perform math on dates.
- Designer:
Designer is the interface where you create dashboards. There are two versions: dashboard designer (the new one) and classic designer (the legacy one).
- Measure:
A measure is a quantitative value, like revenue and exchange rate. You can do math on measures, such as calculating the total revenue and minimum exchange rate.
- Dimension:
A dimension is a qualitative value, like region, product name, and model number. Dimensions are handy for grouping and filtering your data. Unlike measures, you can’t perform math on dimensions.
- Explorer:
Explorer is the interface where you explore datasets and lenses.
- Extended Metadata (XMD):
Extended metadata (XMD) allows you to customize the formatting of many dashboard elements in Analytics.
- External Data:
External data is data that resides outside of Salesforce, such as data from outside applications and spreadsheets. External Data API.
Use External Data API to upload external data files to Analytics to create datasets.
- Lens:
A lens is a particular view into a dataset’s data. It’s where you do exploratory analysis and visualization.
- Metadata file:
A metadata file is a JSON file that describes the structure of an external data file. Predicate
- Predicate:
A predicate is a filter condition that defines row-level access to records in a dataset. Salesforce Analytics Query Language (SAQL)
- Salesforce Analytics Query Language (SAQL):
Use SAQL to access and analyze data in Analytics datasets.
- Step:
A step determines the results shown in a widget. Steps either get data dynamically or statically.
For example, a step can query a dataset to get the average opportunity amount for each account, or it can retrieve an unchanging, user-defined value.
- Transformation:
A transformation refers to the manipulation of data.
You can add transformations to a dataflow to extract data from Salesforce objects or datasets, transform datasets that contain Salesforce or external data, and register datasets.
- Unit of symbol (for measures):
A unit symbol represents the unit of a shortened number that appears in a chart or number widget. Analytics uses the following symbols.
- Visualization:
A visualization is commonly a chart or graph, such as a bar chart, donut chart, timeline, or heat map. It can also be data in tabular form, such as a comparison table or pivot table. Every visualization has an underlying query, which is how Analytics retrieves information from the source data.
| Symbol |
Unit |
Example |
| K | Thousand (10^3) | 4K = 4,000 |
| M | Million (10^6) | 4M = 4,000,000 |
| B | Billion (10^9) | 4B = 4,000,000,000 |
| T | Trillion (10^12) | 4T = 4,000,000,000,000 |
| P | Quadrillion (10^15) | 4P = 4,000,000,000,000,000 |
| X | Quintillion (10^18) | 4X= 4,000,000,000,000,000,000 |
| Z | Sextillion (10^21) | 4Z = 4,000,000,000,000,000,000,000 |
| Y | Septillion (10^24) | 4Y = 4,000,000,000,000,000,000,000,000 |
| m | Thousandth (10^-3) | 4m = 0.004 |
| μ | Millionth (10^-6) | 4μ = 0.000004 |
| n | Billionth (10^-9) | 4n = 0.000000004 |
| p | Trillionth (10^-12) | 4p = 0.000000000004 |
| f | Quadrillionth (10^-15) | 4f = 0.000000000000004 |
| a | Quintillionth (10^-18) | 4a = 0.000000000000000004 |
| z | Sextillionth (10^-21) | 4z = 0.000000000000000000004 |
| y | Septillionth (10^-24) | 4y = 0.000000000000000000000004 |
EA Resources